Laurent Sansonetti runtime

As you may know we have been working on bringing Mono to the WebAssembly platform. As part of the effort we have been pursuing two strategies; one that uses the new Mono IL interpreter to run managed code at runtime, and one that uses full static (AOT) compilation to create one .wasm file that can be executed natively by the browser.

We intend the former to be used for quickly reloading C# code and prototyping and the latter for publishing your final application, with all the optimizations enabled. The interpreter work has now been integrated into Mono’s source code and we are using it to develop, port and tune the managed libraries to work on WebAssembly.

This post is about the progress that we have been making on doing static compilation of .NET code to run on WebAssembly.

mono-wasm in action

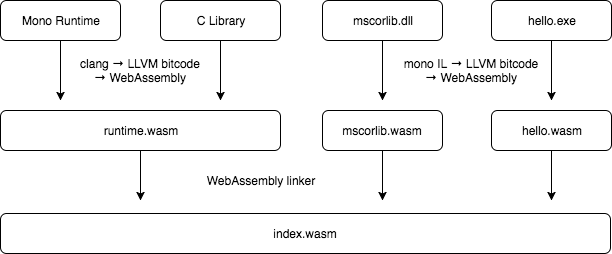
WebAssembly static compilation in Mono is orchestrated with the mono-wasm command-line tool. This program takes IL assemblies as input and generates a series of files in an output directory, notably an index.wasm file containing the WebAssembly code for your assemblies as well as all other dependencies (the Mono runtime, the C library and the mscorlib.dll library).

$ cat hello.cs
class Hello {
  static int Main(string[] args) {
    System.Console.WriteLine("hello world!");
    return 0;
  }
}
$ mcs -nostdlib -noconfig -r:../../dist/lib/mscorlib.dll hello.cs -out:hello.exe
$ mono-wasm -i hello.exe -o output
$ ls output
hello.exe        index.html        index.js        index.wasm        mscorlib.dll

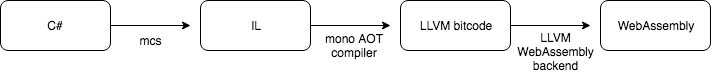
mono-wasm uses a version of the Mono compiler that, given C# assemblies, generates LLVM bitcode suitable to be passed to the LLVM WebAssembly backend. Similarly, we have been building the Mono runtime and a C library with a version of clang that also generates LLVM WebAssembly bitcode.

Until recently, mono-wasm was linking all the bitcode into a single LLVM module then performing the WebAssembly code generation on it. While this created a functional .wasm file, this had the downside of taking a significant amount of time (half a minute on a recent MacBook Pro) every time we were building a project as a lot of code was in play. Some of the code, the runtime bits and the mscorlib.dll library, never changed and yet were still being processed for WebAssembly code generation every time.

We were thrilled to hear in late November of last year that the LLVM linker (lld) was getting WebAssembly support.

Since then, we changed our mono-wasm tool to perform incremental compilation of project dependencies into separate .wasm files, and we integrated lld’s new WebAssembly driver in the tool. Thanks to this approach, we now perform WebAssembly code generation only when required, and in our testing builds now complete in less than a second once the dependencies (runtime bits and mscorlib.dll) have already been compiled into WebAssembly.

mono-wasm's new linking phase

Additionally, mono-wasm used to use the LLVM WebAssembly target to create source files that would then be passed to the Binaryen toolchain to create the .wasm code. We have been testing the backend’s ability to generate .wasm object files directly (with the wasm32-unknown-unknown-wasm triple) and so far it seems promising enough that we changed mono-wasm accordingly. We also noticed a slight decrease in build time.

  Old toolchain New toolchain (First Compile) New toolchain (Rebuild)
Full application build ~40s ~30s <1s
Hello World program ~40s <1s <1s

There is still a lot of work to do on bringing C# to WebAssembly, but we are happy with this new approach and the progresses we are making. Feel free to watch this space for further updates. You can also track the work on the mono-wasm GitHub repository.

For those of you that want to take this for a spin you can download a preview release, unzip and run “make” in the samples. This currently requires MacOS High Sierra to run.


Miguel de Icaza runtime

Mono is complementing its Just-in-Time compiler and its static compiler with a .NET interpreter allowing a few new ways of running your code.

In 2001 when the Mono project started, we wrote an interpreter for the .NET instruction set and we used this to bootstrap a self-hosted .NET development environment on Linux.

At the time we considered the interpreter a temporary tool that we could use while we built a Just-in-Time (JIT) compiler. The interpreter (mint) and the JIT engine (mono) existed side-by-side until we could port the JIT engine to all the platforms that we supported.

When generics were introduced, the engineering cost of keeping both the interpreter and the JIT engine was not worth it, and we did not see much value in the extra work to keep it around, so we removed the interpreter.

We later introduced full static compilation of .NET code. This is a technology that we introduced to target platforms that do not allow for dynamic code generation. iOS was the main driver for this, but it opened the doors to allow Mono to run on gaming consoles like the PlayStation and the Xbox.

The main downside of full static compilation is that a completely new executable has to be recreated every time that you update your code. This is a slow process and one that was not suitable for interactive development that is practiced by some.

For example, some game developers like to adjust and tweak their game code, without having to trigger a full recompilation. The static compilation makes this scenario impractical, so they resort to embedding a scripting language into their game code to quickly iterate and tune their projects.

This lack of .NET dynamic capabilities also prevented many interesting uses of .NET as a teaching or prototyping tool in these environments. Things like Xamarin Workbooks, or simple scripting could not use .NET languages and had to resort to other solutions on these platforms.

Frank Krueger, while building his Continuous IDE, needed such environment on iOS so much that he wrote his own .NET interpreter using F# to bring his vision of having a complete development environment for .NET on the iPad.

To address these issues, and to support some internal Microsoft products, we brought Mono’s interpreter back to life, and it is back with a twist.

New Mono Interpreter

We resuscitated Mono’s old interpreter and upgraded its .NET support, adding the support for generics and upgraded it to run .NET as it exists in 2017. Next is adding support for mixed-mode execution.

It is one of the ways that Mono runs on WebAssembly today for example (the other being the static compilation using LLVM)

The interpreter is now part of mainline Mono and it passes a large part of our extensive test suites, you can use it today when building Mono from source code, like this:

$ mono --interpreter yourassembly.exe
...

Mixed Mode Execution

While the interpreter alone is now in great shape, we are currently working on a configuration that will allow us to mix both interpreted code with statically compiled code or Just-in-Time compiled code, we call this mixed mode execution.

For platforms like iOS, PlayStation and Xbox, this means that you can precompile your core libraries or core application, and still support loading and executing code dynamically. Gaining the benefits of having all your core libraries optimized with LLVM, but still have the flexibility of running some dynamic code.

This will allow game developers to prototype, experiment and tweak their games using .NET languages on their system without having to recompile their applications.

It will open the doors for scriptable applications on device using .NET languages as well.

Future work

We are extending the capabilities of the interpreter to handle various interesting scenarios. These are some of the projects ahead of us:

Improvements for Statically Compiled Mono

The full ahead-of-time compilation versions of Mono (iOS, Consoles) do not ship with an implementation of System.Reflection.Emit. This made sense as the capability could not be supported, but now that we have an interpreter, we can.

There are several uses for this.

The System.Linq.Expressions API which is used extensively by many advanced scenarios like Entity Framework or by users leveraging the C# compiler to parse expressions into expression trees, you have probably seen the code in scenarios like this:

Expression sum = a + b;
var adder = sum.Compile ();
adder ();

In Full AOT scenarios, the way that we made Entity Framework and the above work was to ship an interpreter for the above Expression class. This expression interpreter has limitations, and is also a large one.

By enabling System.Reflection.Emit powered by the interpreter we can remove a lot of code.

This will also allow the scripting languages that have been built for .NET to work on statically compiled environments, like IronPython, IronRuby and IronScheme.

To allow this, we are completing the work for mixed-mode execution. That means that the interpreted code complements existing statically compiled .NET code.

Better Isolation

Earlier on this post, I mentioned that one of the idioms that we previously failed to address was the hot-reloading of code by developers that deployed their app and tweaked their game code (or their code for that matter) live.

We are completing our support for AppDomains to enable this scenario.

Researching Mixed Mode Options

The interpreter is a lighter option to run some code. We found that certain programs can run faster by being interpreted than being executed with the JIT engine.

We intend to explore a mixed mode of execution, sometimes called tiered compilation.

We could instruct the interpreter to execute code that is known to not be performance sensitive - for example, static constructors or other initialization code that only runs once to reduce both memory usage, generated code usage and execution time.

Another consideration is to run code in interpreted mode, and if we exceed some threshold switch to a JIT compiled implementation of the method, or use attributes to annotate methods that are worth the trouble and methods that are not worth the trouble optimizing.


Alexander Kyte gsoc

This Summer of Code, the Mono project had many exciting submissions. It’s been great to see what our applicants have been able to accomplish. Some were very familiar with the codebases they worked on, while others had to learn quickly. Let’s summarize how they spent this summer.

CppSharp Defect Removal And General Feature Work

Mohit Mohta and Kimon Topouzidis chose to address a number of bugs and add features to the code of CppSharp. Std::string was added, stacks were fixed, options were added, structure packing was added, and primitive types support was improved. They both seem to have learned a lot about the workflow of methodical debugging of systems code.

Clang Sanitizers

Many software bugs don’t result in immediate errors and crashes. Some corrupt program state in such a way that a cryptic error is seen much later. In the worst case, each such delayed crash may have a different stack trace. Many of these bugs have root causes that can be spotted in a running program the second they go wrong. The tooling to do so has only recently been able to spot race conditions, which can be some of the worst of these bugs. Clang has integrated a number of such sanitizers.

Armin Hasitzka chose to use clang’s runtime sanitizers for race conditions and for memory safety to automatically catch Mono bugs. In his efforts, he ran into false positives and legitimate bugs alike. He fixed a number of bugs, helped silence false positives, and left behind infrastructure to automatically catch regressions as they appear.

CppSharp Qt Bindings And Maintenance

Dimitar Dobrev is familiar to the Mono project. He has done the Google Summer of Code with Mono in 2015, and has helped maintain CppSharp since.

This summer, he sought to commit his time to developing the Qt bindings further. In the development of CppSharp, the problem of mapping C# types onto C++ generics arose. There were many potential solutions, but very few retained the feeling of the underlying API. After some experimentation, the hard problems were solved.

As the summer came to an end, he fixed the minor issues that arose during tests of QtSharp. The burden of maintaining the project and responding to bugs from the community did not stop for Dimiar, resulting in partial completion of milestones yet significant overall contribution. Development of QtSharp proceeds alongside his ongoing maintenance work and contributions.

MonoDevelop C/C++ Extension Feature Enhancements

The CBinding extension for MonoDevelop adds a lot of great functionality for working with C and C++ projects. It is still a work in progress, and Anubhav Singh wanted to add some more functionality. He focused on bringing support for Windows compilers and for CMake. He also chose this moment to update the extension to reflect the newer APIs of MonoDevelop. In the process, he had to begin the process of upstreaming some changes to MonoDevelop.

C# Compiler Caching with CSCache

Something often mentioned around a warm laptop with spinning fans is how nice C developers have it. CCache enables someone to recompile large C projects after minor modifications in a very small amount of time. Going beyond the build system skipping recompilation, the system compiler is wrapped by a program that spits back the old output in a fraction of the time that a compiler takes. This is a trick that managed languages haven’t learned until now.

Daniel Calancea created a tool which wraps mcs and understands the commands sent to it. If it is invoked with the same files and the same options twice, it checks that all of the hashes of all of the files are the same between runs. If so, it returns the output of the C# compiler the first time. Equally important is that this tool will return the same return codes as the first run, and will integrate as seamlessly into any build system as ccache does. It even reports the same warnings that the initial compiler did.

Daniel published this tool for Windows and Linux to Nuget.

Import of System.IO.Pipes.PipeStream from CoreFX

Mono’s implementation of System.IO.Pipes has historically not had some features available to the CLR. After msbuild was made open source, users found that Mono unfortunately could not build in parallel because of the API differences. CoreFX brought with it the promise of a System.IO.Pipes.PipeStream that would enable parallel msbuild. CoreFX’s API surface was not strictly a superset of Mono’s though. Mono implemented a couple of endpoints that CoreFX did not, and we used those endpoints in other places in the BCL.

Georgios Athanasopoulos chose to do the work required to make Mono work with CoreFX’s PipeStream. Modifying both CoreFX and Mono was required. Mono’s build system had to choose to use the new implementation files, rather than looking for them in the BCL directory. His work was a success. Finishing early, he chose to experimentally enable a parallel msbuild and test it. Things seem to be mostly working.

Lamdba Debugger Support

Often when debugging C# code in the middle of a large project, it’s important to invoke code to understand how variables are behaving in a segment of code. Sometimes, the code that one wishes to invoke hasn’t been written yet. The developer is left squinting at variables, invoking existing methods, and manually running code in their head. Much better would be to enable the developer to write a new function and invoke it on the variables in question. Interpreted languages offer support for this without much trouble usually because code doesn’t have as much metadata associated with it, and because they have integrated compilers for the debugged languages.

This summer, Haruka Matsumoto worked on a system that enables developers to use these arbitrary code snippets entered into the debugger. Mono runs the debugger and the debuggee in separate running instances of the runtime. As the running mono runtime for the application being debugged doesn’t have access to a C# compiler, this code has to be compiled by the debugger. The debugger uses Roslyn to compile the code segments, and this assembly is sent to the debugged application’s runtime.

This is made more difficult by the fact that the debugger is trying to run a Lambda that has access to the variables and methods defined in the functions the debugger is currently debugging. Shorter method names need to resolve to what they would if the original function had used them, and variables should be accessible by name. Issues with private types are potentially unsolvable without special casing, as mono prevents arbitrary code from modifying private fields. Haruka handled these and other difficult considerations, and delivered a very strong prototype of Lambda support in the integrated runtime debugger. It should be immediately useful for anybody who spends a lot of time using mono to debug C# code.

Import Synchronization Primitives from CoreRT

It is often the case that small differences in the implementations of core runtime functions can result in perceived bugs introduced by switching runtimes. The differences are due to depending on API behavior that may not be entirely defined by the specification, but works in a certain case on a certain machine. This sensitivity is nowhere more baffling to debug than around threading and synchronization primitives. The .NET Core Project contains an open-source, cross-platform implementation of C# synchronization primitives. We expect this to receive much community development and user testing. We hoped to import them to gain both consistent behavior and quality.

This summer, Alexander Efremov imported EventWaitHandle, AutoResetEvent, ManualResetEvent, Mutex and Semaphore into Mono. He both manually integrated these libraries into Mono and automated the process of building them. System.Private.CoreLib.Native was successfully added to mono. System.Threading was identified as the next API to import, in order to enable importing Thread from CoreFX.


Alex Rønne Petersen profiler, runtime

As part of our ongoing efforts to improve Mono’s profiling infrastructure, in Mono 5.6, we will be shipping an overhaul of Mono’s profiler API. This is the part of Mono’s embedding API that deals with instrumenting managed programs for the purpose of collecting data regarding allocations, CPU usage, code coverage, and other data produced at runtime.

The old API had some limitations that prevented some features and capabilities from being implemented. The upgrade to the API will allow us to:

  • Reconfigure the profiling features at runtime
  • Look at the values of incoming parameters and return values.
  • Ability to instrument the managed allocators, thus allowing these to be profiled.

This is what we did.

Reconfigure Profiling at Runtime

We wanted the ability to reconfigure the profiling option at runtime. This was not possible with the old API because none of the API functions took an argument representing the profiler whose options should be changed.

This means that it was only possible to change options of the most recently installed profiler, and this was not guaranteed to be the one you wanted. Additionally, doing so it was not thread safe.

Why would we want to change profiling options at runtime, you might wonder? Suppose you know that only a particular area of your program has performance issues and you’re only interested in data gathered while your program is executing that code. With this capability, you can turn off profiling features such as allocations and statistical sampling until you get to the point you want to profile, and then turn them on programmatically. This can significantly reduce the noise caused by unneeded data in a profiling session.

Call Context Introspection

Call context introspection allows a profiler to instrument the prologue and/or epilogue of any method and gain access to arguments (including the this reference), local variables, and the return value.

This opens up countless possibilities for instrumenting framework methods to learn how a program is utilizing facilities like the thread pool, networking, reflection and so on. It can also be useful for debugging, especially if dealing with assemblies for which the source code is not available.

Instrumenting Managed Allocators

Another improvement we were able to make thanks to the redesigned API was to use instrumented managed allocators when profiling. In the past, we would disable managed allocators entirely when profiling. This would slow down allocation-heavy programs significantly. Now, we insert a call back to the profiler API at the end of managed allocators if profiling is enabled.

Simpler to Work With

On top of these major features, the new API is also simply more pleasant to use. In particular, you no longer have to worry about setting event flags; you simply install a callback and you will get events. Also, you no longer have to use callback installation functions which take multiple callback arguments. Every kind of callback now has exactly one function to install it. This means you will no longer have code such as mono_profiler_install_assembly (NULL, NULL, load_asm, NULL); where it can be unclear which argument corresponds to which callback. Finally, several unused, deprecated, or superseded features and callbacks have been removed.

Breaking Change

The new API completely replaces the old one, so this is a breaking change. We try very hard to not break API/ABI compatibility in Mono’s embedding API, but after much consideration and evaluation of the alternatives, a breaking change was deemed to be the most sensible way forward. To aid with the transition to the new API, Mono will detect and refuse to load profiler modules that use the old API. Developers who wish to support both the old and new APIs by compiling separate versions of their profiler module may find the new MONO_PROFILER_API_VERSION macro useful.

A presentation with more details is available in PowerPoint and PDF formats.


Alexander Köplinger releases

Mono 5.2 is out in the stable channel !

Check out our release notes for more details about what is new on Mono 5.2.

This release was made up of nearly 1000 commits since Mono 5.0 and is the result of many months of work by the Mono team and contributors!