This page is likely outdated. Visit the new documentation for updated content.
HeapShot in action
Heap Shot is a graphical UI used to explore memory allocation patterns in an application. It processes log files generated using the standard profiling tools.
HeapShot can either explore one snapshot of the heap, or it can be used to compare the objects in two separate snapshots from different points in time.
Obtaining Heap Shot
If Heap Shot does not have an installer or package for your operating system, it is relatively easy to build. The source code is located on github at https://github.com/mono/heap-shot . Once it has been checked out, you can simply run ‘xbuild’ in the heap-shot directory or you can open the solution file in either MonoDevelop or VisualStudio and build it there.
If you are unfamiliar with Git, you should read the Git Faq for information on how to check out the code.
Enabling the profiler
Heap Shot relies on the Log Profiler shipped as part of Mono 2.10+ and also the sgen garbage collector to generate the required profiling data. To enable the profiler in heapshot mode you must run the application to be examined with the following command line:
mono --gc=sgen --profile=log:heapshot MyProgram.exe
This activates the sgen garbage collector and also the profiler in ‘heapshot’ mode. This will result in the profiler writing a dump of every live object at the end of every garbage collection to a log file called ‘output.mldp’.
Note: By default the log profiler will not overwrite an existing log file. You must either specify a different filename when launching the profiler, as described in the documentation or you must delete/rename existing logs before running the profiler.
Using the GUI for HeapShot
When you are happy that your application has run long enough to generate useful statistics, open the log file in Heap Shot. This can be done by clicking on ‘Open’ in Heap Shot and navigating to the file:
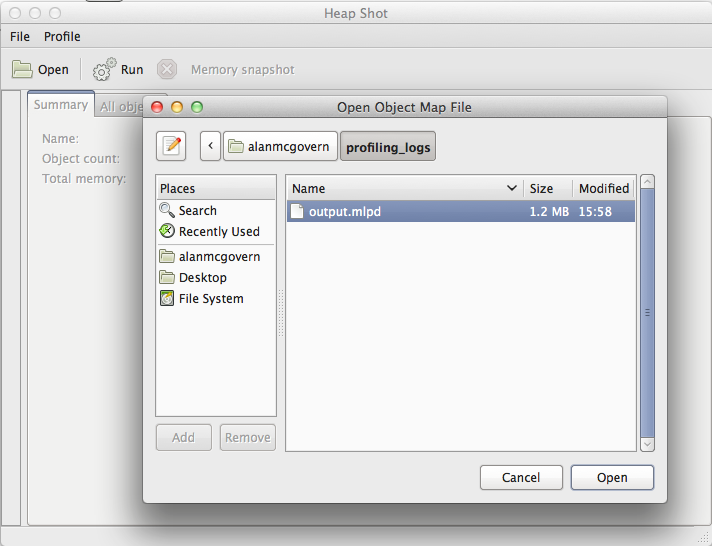
Once a log file has been opened, you will be presented by a screen similar to this:
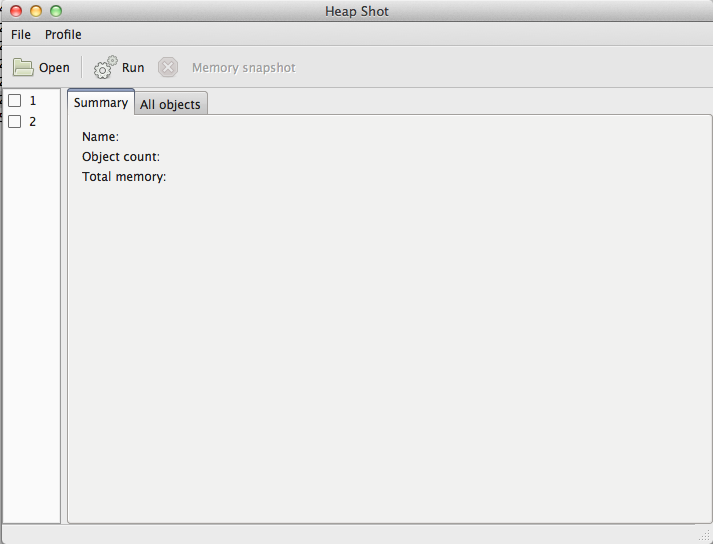
The left hand side of the screen contains an entry for every heap snapshot. In this case there were two garbage collections before the application exited. By clicking on one of these snapshots and viewing the ‘All objects’ tab, you can quickly inspect a number of metrics such as:
- The types that are being created.
- Number of instance of the objects created (default sorting)
- Memory used by these instances.
- Average size of these objects.
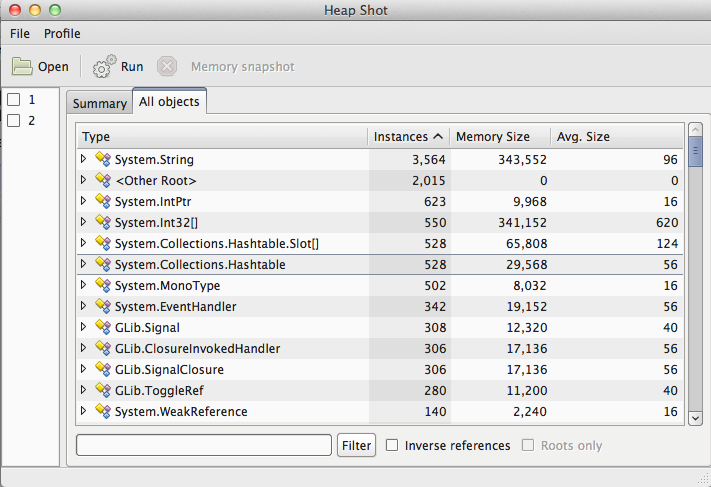
There are two ways to view the information in the heap:
- Viewing which objects the current object references.
- Viewing objects that reference the current type.
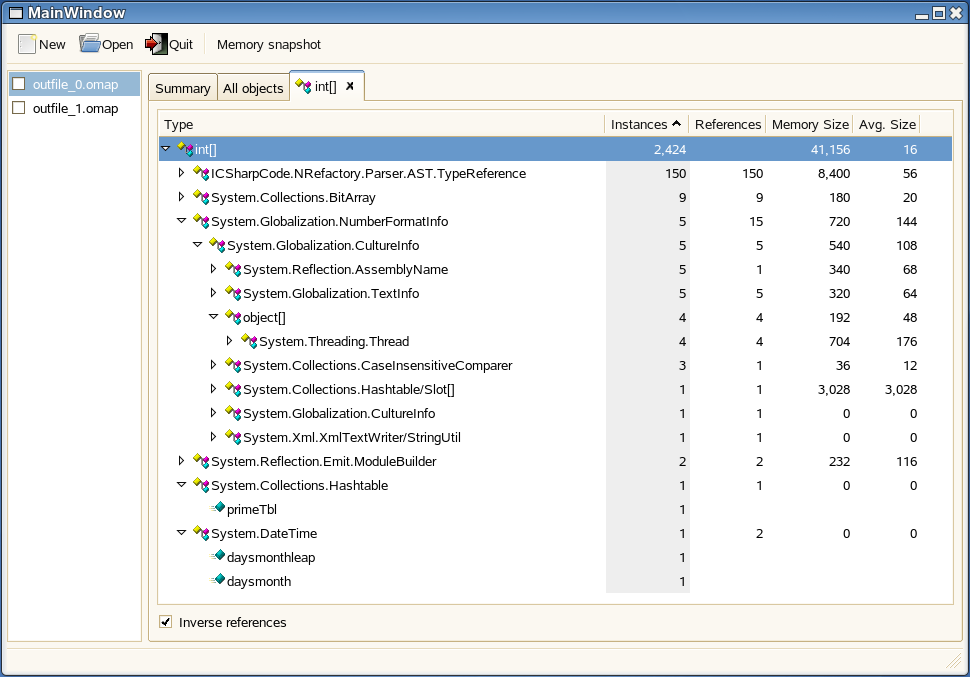
The default mode is to display a list of types and as you expand each type you can see what objects are being referenced by that type and also the quantity of each object. You can also use the “Filter” function at the bottom to limit the display of types to a given type name or namespace.
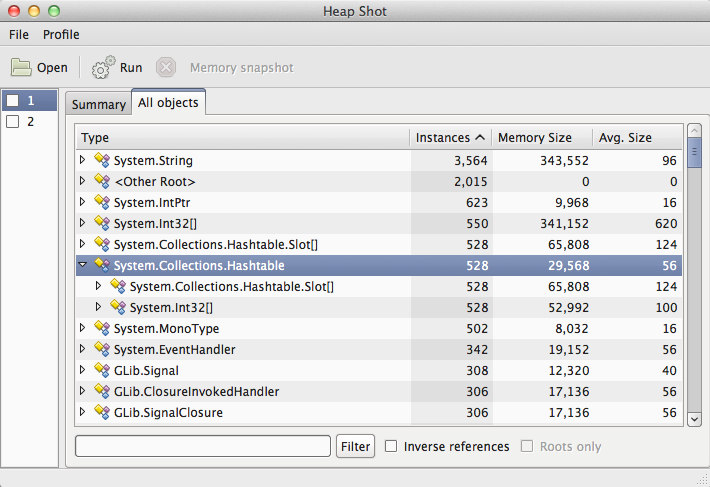
As you can see, the mono System.HashTable class references both System.Int32[] types and System.Collections.HashTable.Slot[] types. As the quantities of these three types are all the same, it’d be safe to assume that every System.HashTable creates one Slot[] and one Int32[] object.
To view the objects that keep references to a given type, click on “Inverse references” at the bottom of the screen. This will allow you to see what types reference the current type so you can figure out why something is being retained in memory. The best way to do this is to double click on the type you are interested in and then click on “Inverse References”.
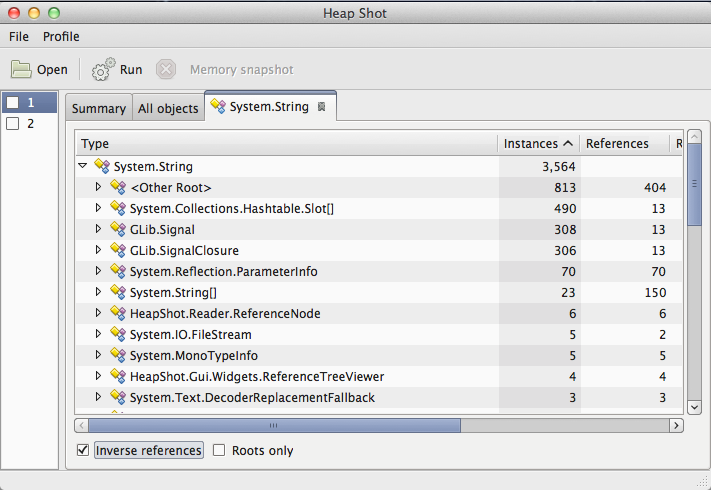
From this screenshot you can see which types store reference to System.String objects and the quantity of System.Strings that each type retains. This mode is invaluable when trying to figure out why objects you expect to have been GC’ed are actually still in memory. You can keep expanding the toggles to see why other objects are being kept alive. For example System.String is being kept alive by GLib.Signal. To see why GLib.Signal is kept alive you can simply expand that node. Alternatively you can double click on GLib.Signal and once again click on ‘Inverse References’ for that view.
Visualizing Changes
It is possible to examine which objects were created between two snapshots in time. To do this, snapshot the application twice, then set the checkbox on the snapshot that you want to use as a reference, and then select the second snapshot.
The results displayed on the GUI will be only for the differences.