This page is likely outdated (last edited on 02 Dec 2009). Visit the new documentation for updated content.
MonoVisualProfiler
Mono Visual Profiler
Overview
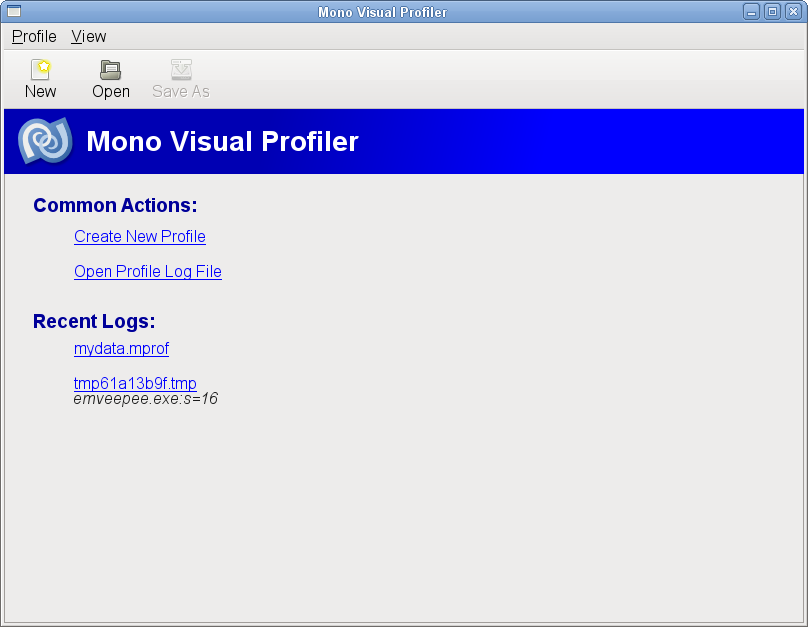
The Mono Visual Profiler is a graphical interface to the mono logging profiler. It enables users to create new profiles, save them, and view existing profile logs. The application strives to provide better data visualization than is capable via the existing cmdline profiler and file decoder.
Development is in its initial stages, with the tool located in the emveepee svn module. No public releases have occurred yet. The tool is being developed as a widget library with a thin wrapper application embedding the profile view widget and driving profile log file operations. A MonoDevelop addin is also provided optionally by emveepee for integrated profiling of .Net projects.
Features
This list is intended to be a dynamic set of desired and existing capabilities for the profiler. We will strive to keep it relatively current with the state of development.
Current Capabilities
Create New Profile
Support for executing an assembly for the following logging profiler modes:
 * Allocations
 * Calls/Instrumented
 * Statistical
Interactive profiling
| When creating new profiles, you can start with logging disabled or enabled via a checkbox in the Profile Setup Dialog. Logging can be enabled and disabled via the Run | LoggingEnabled menu item once the target application is launched. Profiles are displayed each time logging is disabled, and when the profiled application is terminated. |
Open Existing Profile Log
Profile logs created via the cmdline with mono –profile or saved from the graphical interface can be opened in the tool to visualize the data. The profiler log format has already been extended to provide some of the current visualization feature set so some features may not be available for older file formats.
Save profile log
Profile logs created within the gui can be saved to specified locations on disk for sharing with others or reopening at a later date.
Recent Log history
| The previous 5 logs viewed in the application are available for one-click opening from the “Recent Logs” section of the start page, as well as from the Profile | RecentLogs menu. |
Repeat Session creation
| The ability to repeat a session with a single click from the start page, or from a Profile | RepeatSession menu. The previous 5 session configurations will be saved to the history file to facilitate repeating common profiling sessions easily. |
Allocation Mode Tree View
A simple two level allocation tree view is available with Class root nodes and Allocation method child nodes for each class. The table is sorted by bytes allocated.
Calls/Instrumented Mode Tree View
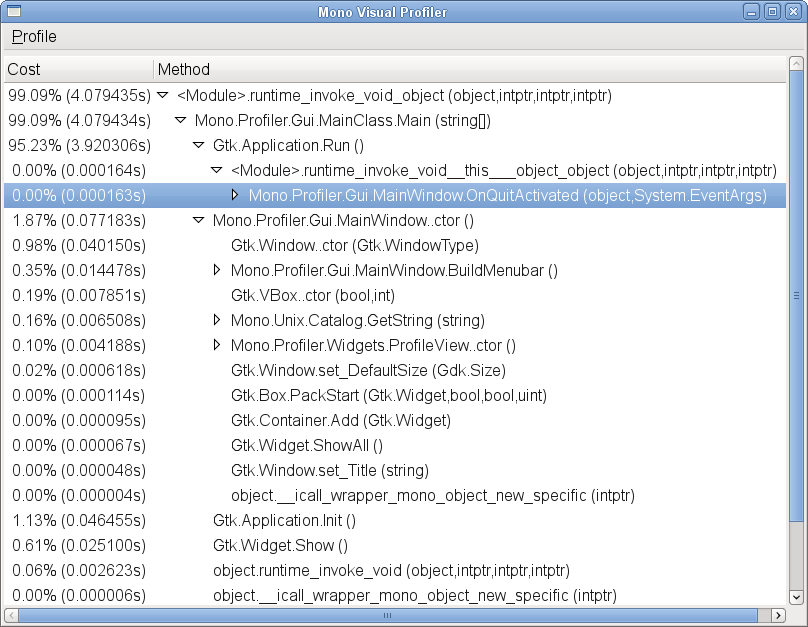
For instrumented/calls mode profiles, a call flow tree view with library based flattening is available. Currently, the only supported flattening option is the flattening of System library methods. For example, if a System Library method such as Gtk.Application.Run is called, the tree is flattened until a non-system method child node is found. A “Show System Nodes” menu item can be switched on to disable this flattening which is on by default.
Statistical Mode View
A simple list/details mode for statistical data is available. The List is sorted by descending hit frequency. Selecting an item in the list populates the details pane with a list of calls the selected method makes and methods which call the selected method.
Planned Features
Asp.Net Profile Creation
The ability to create Asp.Net profiles without resorting to cmdline. I envision a UI which launches xsp for a path and port and opens a browser on the port to interact with the web app. This will obviously be more complex than simply running an exe, but should be easy enough to do. Will have to open up the filters on the file chooser to accept aspx files in addition to exe.
Proportional Area Maps of profile data for all modes
A view similar to the TreeMaps found in other profilers which shows the relative costs of methods or classes in the overall profile.
Heap Snapshot Mode View
A view to depict the heap snapshot profile mode data visually. Reference graphs are a likely mechanism to use here to track down circular references and reference leaks.
Heap Shot style profiling
Integration of a mode similar to Lluis Sanchez’s nice heap shot profiler which does differencing for two snapshots of the heap to depict how the heap is changing over time.
Visual Call Graphs for Calls and Stat modes
Gtk.TreeView is boring. We want to have more flow diagram visual support. This is tricky because it gets very clumsy quickly unless you can prune like crazy. Refocusing the tree and auto-collapse of un-focused data will be important to keep it from getting out of hand.
Filtering/Flattening for all modes
Most people are not going to be interested in seeing every C function hit in a statistical profile log. That sort of information can be interesting to people who want to optimize all the way up the stack, but for most people, they will just want to know “calling Regex.Replace cost x percent” not what C methods are invoked by the internal implementation of Regex.
Multi-mode profiling
The mono logging profile support collection of profiling data for multiple modes at the same time. While calls and stat aren’t a likely pair of modes to run concurrently, either of those modes with allocations is conceivably a reasonable multi-mode profile combination. There may be others that are interesting.